


“Is it graphic recording, live illustration or visual notes? Which do I need?”
A breakdown of what each term means, and how they can work for you.
I’ll be the first to admit: for an industry dedicated to making complex information clear and accessible, our own jargon and overlaps can be confusing.
There are a lot of names for graphic recording, and while there are important distinctions between many, some are interchangeable.
So, here is your simple guide, complete with real world examples, to the most popular terms and what they actually mean for your event or project.
Graphic Recording
Live on-site, live online or from your files.
Starting with what I most commonly call myself, and the most broadly used term for capturing written or spoken content visually, is graphic recording.
This can be live at in-person events like conferences, summits and workshops; or for virtual and hybrid events like online meetings and webinars. Basically, wherever ideas and information are shared, graphic recording uses visual storytelling in real time to make it easy to understand and remember. We’ll come back to live graphic recording in a little more detail next, along with its interchangeable names.
But graphic recording isn’t always live. We use many of the same techniques to transform written or audio material like podcasts, reports, even a stack of scribbled notes, into clear and concise visuals that capture audience attention, deliver the key points, and spark interest in the full piece (it’s your hard work, after all!)
✨Live✨ Graphic Recording
AKA: visual minutes, event scribing, visual note taking, and event illustration
I see the above names being used interchangeably, and when I’m introduced at events as any of them, I’m happy. Whether I’m in the room at a panel talk or keynote session, or virtually joining an online meeting, my role remains the same:
Transforming thousands of spoken words into a single, cohesive graphic that everyone can follow in the moment and refer back to afterwards.
I will also add that not all live illustrators are graphic recorders. Many live illustrators create portraits at weddings or fashion events, and some paint murals or large scale pieces as performance art. But when live illustrators are translating ideas and information into pictures, to amplify and clarify meaning? That’s graphic recording.
Here’s what a visual summary captured live can look like (all examples are linked to the event/project’s case study):

I illustrated this at a charity event hosted by a number of corporate companies, a combined effort to celebrate their people, challenge sporting stereotypes and connect with their wider audiences. Having a shareable visual of the day allowed them to compound this effect by including it in their follow up communications and social platforms.
One of the best things about live graphic recording is that it can be made an event feature, so as well as having a lasting visual memory, event attendees can watch speakers’ words come to life in real time.
Some graphic recorders work with traditional materials, illustrating with pens on a large board, flip chart, I’ve even seen whole walls filled! Many event organisers favour this approach for its tactile feel and the ability to keep something physical.
For digital graphic recorders like me, ideas and information are instead scribed on a device like an iPad. The magic is made visible by beaming my digital canvas onto venue monitors or for digital events, streaming from the iPad to the meeting platform; throughout, at key points, or as a reveal at the end.
Digital scribes are highly mobile and flexible, and have the ability to:
Blend in among the audience, for events where live illustration is a surprise at the end.
Move subtly between in-depth workshops or more sensitive discussions.
Easily change rooms for larger events like conferences, to capture a cross section of the day.
My favourite benefit of working digitally, though, is the ability to instantly share high fidelity files (right after the event in fact), with the option to adapt an event’s visual summary to different formats quickly, like a printed postcard, wall art, even to provide spot illustrations for clients to simply drop into presentations and documentation about the event or its content.
Illustrated Infographics & Visual Summaries
Some call it non-live or studio graphic recording.
While live graphic recording captures events in the moment, infographics and visual summaries allow you to send over audio, slide decks or lengthy documents and receive a beautifully structured visual summary ready to share.
Unlike ‘standard’ corporate infographics (which can sometimes feel a bit generic or sterile), infographics by a graphic recorder are often hand-drawn, and have a human warmth that draws people in, making complex ideas feel instantly approachable. This is why you might see me calling them “illustrated infographics” or “visual summaries” to make that distinction clear.
I distill dense content like research reports and study findings into single, high-impact visuals that capture the attention of everyone from laymen to other busy researchers, and drive readers to your full work.
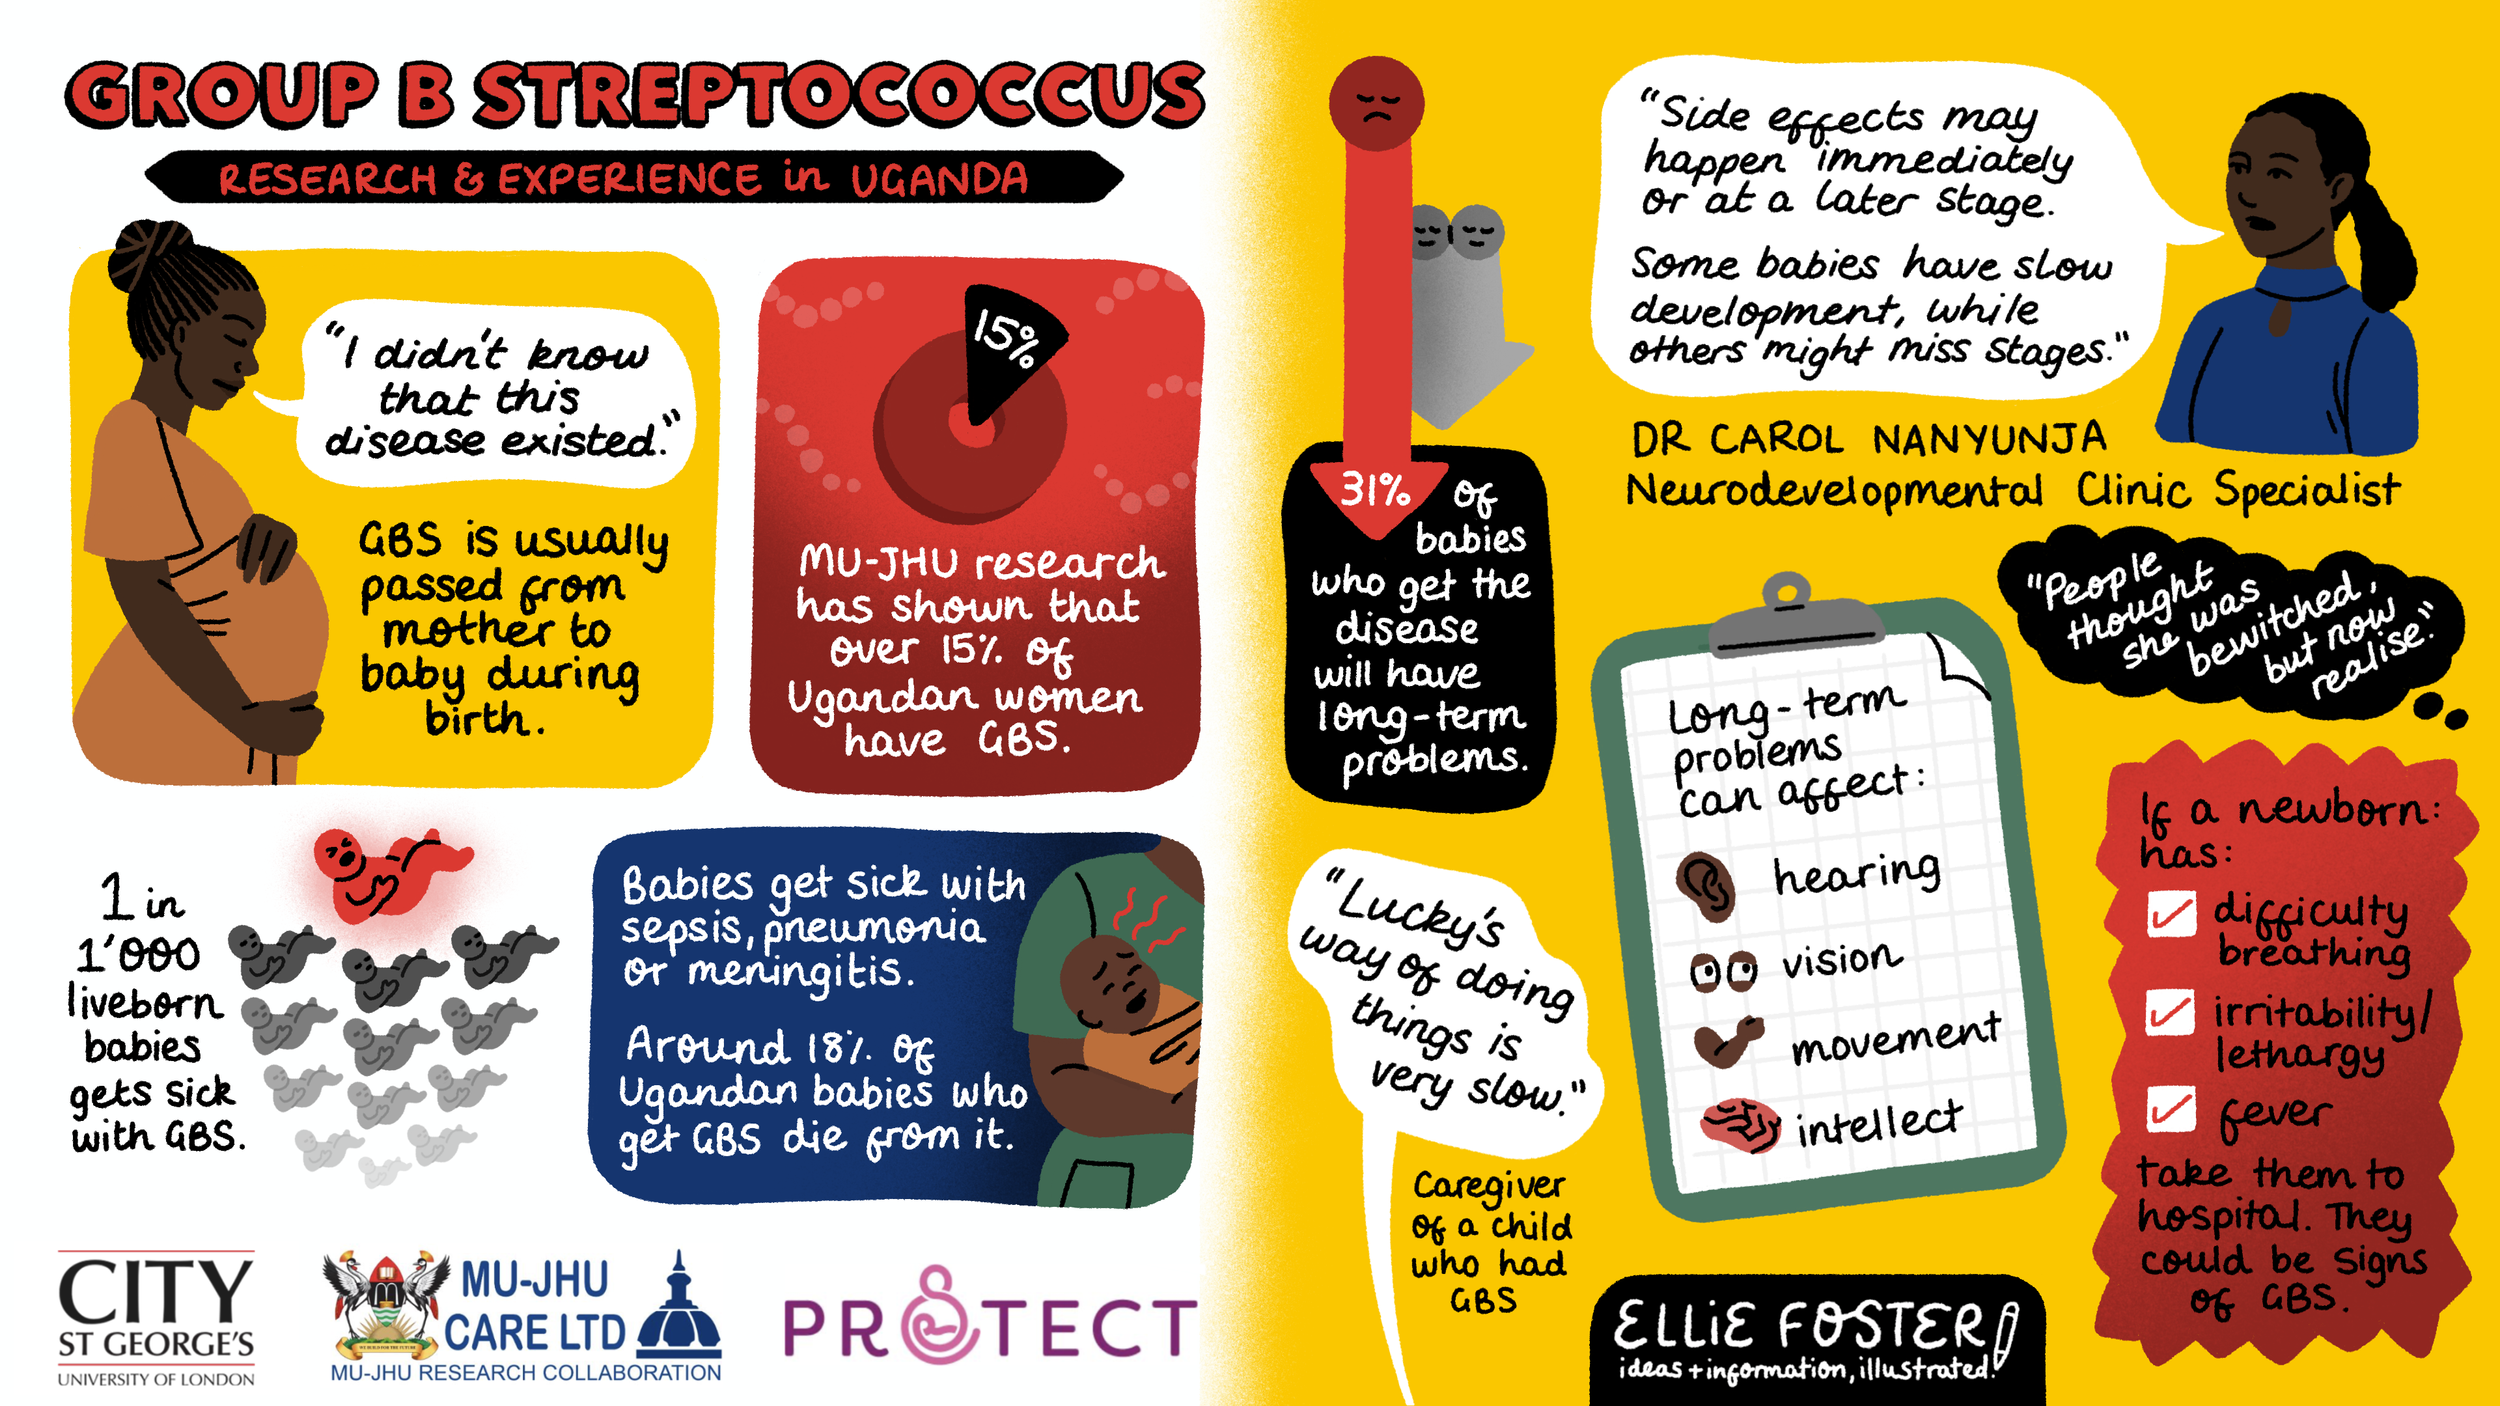
Below, a health research team's film and report were transformed into an engaging visual summary designed to hold audience attention during presentations.
Rich Pictures, Visual Facilitation, Knowledge Synthesis…
Other terms you might hear, and how they connect.
Depending on your industry, you might come across a number of other terms. Some have key distinctions, while others are basically synonyms for graphic recording.
Rich pictures, for example, specifically focuses on mapping complex systems and interconnections within a single frame. Visual facilitators may take on an active role in steering group processes, or design and guide interactive exercises. Some practitioners specialise purely in one of these services, but for many, it’s part of the broader practice of graphic recording; I’ve created corporate rich pictures and visual facilitation tools, among many other projects.
Personally, I find it simplest to work under the broader term for turning heavy or wordy ideas into clear visuals: graphic recording. This way, instead of getting caught up thinking “which subcategory does this fall into?” I get to know your event or material, and design a visual summary tailored to its unique content, audience and goals.
Let’s Chat
If this guide has left you with any questions, or you’d like to check on my availability for your event or project, you’re very welcome to get in touch, either by emailing hi@elliefoster.com or by setting up a complimentary 15 minute call with the below scheduler.
There’s no obligation; I love to hear what people considering live illustration or infographics are working on.